
Discover everything you need to know about Ordnance Survey, from its detailed paper maps and digital mapping products to modern geographic databases and mapping data. Learn how Ordnance Survey maps work, understand different map scales, explore OS MasterMap and the National Geographic Database, and see how accurate mapping data supports planning, GIS, navigation, business, environmental analysis, and everyday decision-making.
Table of Contents
- Understanding Ordnance Survey and Its Role in Mapping
- The Different Types of Ordnance Survey Maps
- Understanding OS Mapping Scales
- What Is OS MasterMap Topography Layer?
- The Ordnance Survey National Geographic Database
- How Ordnance Survey Mapping Data Is Used
- Choosing the Right OS Mapping Data
- Conclusion
- FAQs
Understanding Ordnance Survey and Its Role in Mapping
What Is Ordnance Survey?
When people think about maps of Great Britain, Ordnance Survey (OS) is one of the first names that comes to mind. Ordnance Survey is the UK’s national mapping agency and produces some of the country’s most detailed geographic information. Its work goes far beyond the familiar folded paper maps found in outdoor shops. Today, OS provides detailed digital mapping, geographic databases, APIs, imagery and specialist datasets that can support everything from walking and tourism to infrastructure planning, emergency response and sophisticated geographic information systems. The organisation’s digital mapping portfolio currently covers products ranging from detailed large-scale datasets to national-scale mapping and imagery.
That distinction is important because an Ordnance Survey map is not simply a picture of Britain. Behind many OS products sits structured geographic information describing physical and administrative features. A building, road, river, path, field or boundary can be represented as geographic data that a computer can store, analyse and combine with other information. This makes OS mapping useful in situations where simply looking at a map is not enough. For example, a local authority could combine geographic features with information about services, transport or land management, while an outdoor enthusiast might simply use an OS Explorer map to understand footpaths, terrain and nearby features. The same underlying idea—accurately representing where things are—can therefore serve very different purposes.
Why OS Mapping Data Matters
Reliable geographic information is often the quiet foundation behind decisions that people rarely associate with mapping. Imagine planning a new housing development without knowing exactly where roads, water features, buildings, boundaries and other physical objects are located. Or imagine designing an emergency response system without dependable location information. Errors in geographic data can quickly become practical problems, which is why authoritative mapping is valuable to organisations that make location-based decisions.
Modern OS data is particularly significant because it can be used in digital workflows rather than remaining confined to printed maps. The OS National Geographic Database, for example, is described by Ordnance Survey as a single store of authoritative data for Great Britain, structured for analytical applications. Its data can be accessed through download services and APIs, allowing users to retrieve and work with geographic information in ways that suit their own systems.
The Different Types of Ordnance Survey Maps
OS Explorer and Landranger Maps
Two of the best-known traditional OS map families are OS Explorer and OS Landranger. They are particularly familiar to walkers, hikers, cyclists, tourists and anyone who needs a detailed understanding of the landscape. Explorer maps are associated with the 1:25,000 scale, making them useful when detailed local information matters. Landranger maps use a 1:50,000 scale, providing a broader regional view while still showing a substantial amount of geographic detail.
The difference between the two is easier to understand if you think about zooming a digital map. At a closer zoom level, you can see individual paths, small landscape features and local detail. Pull the map farther away, and you gain a bigger picture but lose some of those fine details. That is essentially what map scale helps communicate. The choice between mapping scales depends on what you are trying to accomplish: a long-distance journey across a region may benefit from broader coverage, while detailed walking navigation may require a closer view.
OS’s current maps and imagery portfolio includes both leisure-oriented mapping and digital alternatives to its popular paper map series. The portfolio also includes products designed for local, regional and national mapping contexts.
Digital Mapping Products
Digital OS mapping has transformed how geographic information can be consumed. Instead of buying or printing a fixed map, organisations can integrate geographic information into GIS platforms, databases, websites and applications. Digital products can also provide more flexibility because users may be able to select an area, theme, format or level of detail appropriate to their project.
This is particularly useful when geographic information needs to be combined with another dataset. A map might show roads and buildings, while a separate database contains information about customers, assets, environmental conditions or public services. Bringing those datasets together creates a much richer picture. In other words, digital mapping turns the map from a static document into a component of a larger information system.
Understanding OS Mapping Scales
Large-Scale Mapping
Map scale can initially sound complicated, but the basic concept is straightforward. A scale of 1:1,250, for example, means that one unit on the map represents 1,250 of the same units on the ground. A smaller denominator generally indicates a larger scale and therefore allows more local detail to be represented. Conversely, a map covering a huge geographic area will generally use a smaller scale and show less fine-grained information.
OS products cover a wide range of scales. OS MasterMap Topography Layer, for example, is designed for detailed representation and supports scales from approximately 1:1,250 to 1:10,000, with the appropriate capture scale varying according to the density and character of features in different environments.
Why Scale Changes the Level of Detail
Think of scale as the difference between looking through a magnifying glass and looking through a window. A magnifying glass lets you concentrate on a small area and see fine detail, whereas a window gives you a wider view but cannot reveal every tiny feature. Mapping works in much the same way. A detailed urban map may need to distinguish buildings, walls, paths and other small objects, while a national map may concentrate on major roads, settlements, rivers and broad geographic patterns.
This is why selecting an OS product should begin with the question, “What do I need the map to do?”A very detailed geographic dataset can be suitable if the solution calls for in-depth property or infrastructure investigation. If the goal is simply to understand a large region, a smaller-scale product could be more efficient. Using more detailed data than necessary can increase storage, processing and management requirements without necessarily improving the final result.
What Is OS MasterMap Topography Layer?
Features and Data Structure
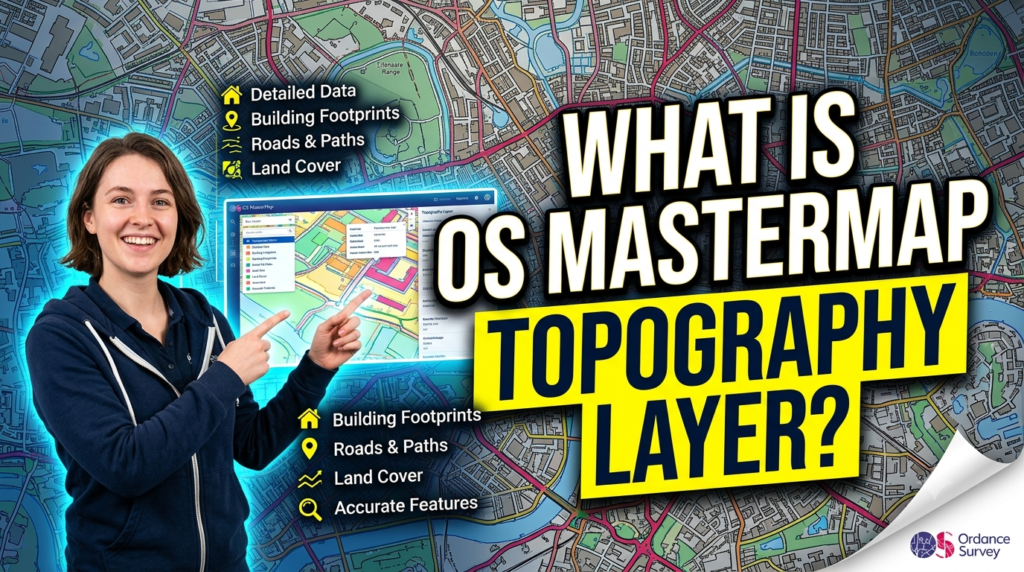
OS MasterMap Topography Layer is one of the most important digital mapping products in the OS portfolio. Ordnance Survey describes it as a detailed representation of the physical landscape of Great Britain, including features such as buildings, roads, rivers, land use and natural features. The current documentation states that the dataset contains more than 500 million real-world objects, each represented within a structured geographic model.
The data is divided into themes covering areas such as buildings, land, transport, water, structures, terrain and height, heritage and administrative boundaries. These themes help users understand what types of information are contained within the dataset. Rather than treating the map as a single image, the system represents geographic objects as data features that can be queried, analysed and combined with other information.
For technical users, this feature-based approach is extremely useful. Geographic information can be represented using points, lines and polygons, depending on the nature of the real-world object. A particular feature can also carry attributes that provide additional information about it. This structure makes the dataset suitable for GIS analysis, asset management, planning and other applications where the geographic relationship between objects matters.
TOIDs and Geographic Referencing
One of the concepts associated with OS MasterMap is the Topographic Identifier, or TOID. Each identifiable topographic feature has a unique reference, helping users distinguish one feature from another and maintain relationships with geographic information over time. OS documentation explains that these identifiers sit at the heart of the MasterMap approach.
Why is that useful? Consider a database containing thousands of geographic objects. Simply storing shapes is not always enough because organisations also need a reliable way to reference individual objects and associate information with them. Persistent identifiers make it easier to connect geographic features with other records and support workflows that depend on accurate location information.
OS MasterMap Topography Layer is available in formats including GeoPackage, GML and vector tiles, depending on the supply method and application requirements.
The Ordnance Survey National Geographic Database
How the OS NGD Works
The Ordnance Survey National Geographic Database (OS NGD) represents a major development in how OS geographic information is organised. Rather than thinking about mapping as a collection of separate, disconnected products, the NGD provides a central store of authoritative geographic data for Great Britain. OS says the database is designed for analytical uses and is intended to make it easier to discover, access and work with geographic information.
The database is organised into themes, collections and feature types. These can include information relating to addresses, buildings, land, transport, boundaries and water. This organisation matters because modern GIS projects rarely need “a map” in the traditional sense. They often need a particular subset of geographic features—for example, buildings within a specified area or transport features meeting certain criteria.
The OS NGD approach allows users to filter and configure data according to their requirements instead of necessarily downloading entire datasets. This can make geographic workflows more targeted and efficient, particularly for organisations working with large volumes of information. OS also highlights daily updates for the NGD, reinforcing its role as a maintained source of geographic information rather than a static map archive.
Data Access Through APIs
APIs have become an increasingly important part of modern mapping because applications need geographic information to arrive in a structured, machine-readable form. The OS NGD API – Features, for example, allows users to access detailed geometries and attributes using spatial, attribute and time-based queries. It is based on the OGC API – Features standard, which supports interoperability with a range of GIS software and web-mapping technologies.
There is also the OS NGD API – Tiles, which provides a vector-tile basemap for interactive web mapping. According to current OS documentation, the service supports scales ranging from national-level views down to building-level mapping and is updated weekly. Users can work with OS styles or create their own visual presentation, which makes the service useful for websites, applications and interactive mapping platforms.
This API-based approach changes the relationship between a map and an application. Instead of treating the map as something that has to be manually recreated every time information changes, software can request the geographic information it needs. That can help organisations build location-aware services, automate workflows and present geographic information dynamically.
How Ordnance Survey Mapping Data Is Used
Business, Planning and Government Applications
The usefulness of OS mapping data extends far beyond navigation. Businesses can use geographic information to understand markets, locate assets, plan services and analyse customers by area. Developers and planners can examine the physical environment surrounding potential sites. Public-sector organisations can use geographic information for service delivery, infrastructure management, land administration and emergency planning.
Consider a simple example: a council wants to improve refuse collection routes. Geographic data can help describe roads, access points, buildings and the wider transport network. When those features are combined with operational information, analysts can develop more informed routes and identify potential inefficiencies. OS specifically cites use cases involving refuse collection, school travel planning and emergency response for its NGD API – Features.
Environmental applications are another major area. Geographic data can support analysis of land cover, water features, terrain and other aspects of the physical landscape. Analysts can combine mapping information with environmental datasets to study patterns, assess risks or support planning decisions. As a result, mapping becomes less about “where is this?” and more about “what does location tell us about this problem?”
GIS, Routing and Environmental Analysis
Geographic Information Systems (GIS) are among the most important environments for working with OS mapping data. A GIS allows users to layer different types of information on top of one another, analyse spatial relationships and produce maps tailored to particular questions. For example, a planner could combine building information, transport networks, administrative boundaries and environmental data to understand how a proposed development interacts with its surroundings.
Routing is another obvious application. A road or path is not simply a line on a screen; it can represent part of a connected network. When network information is structured correctly, software can use it for route planning and accessibility analysis. OS also provides specialist products such as the OS Multi-modal Routing Network, designed for routing people and goods across different modes of transport.
Environmental analysis demonstrates another strength of geographic data: location allows seemingly unrelated information to be connected. Flood risk, land use, buildings, roads and water features can be examined in relation to one another. OS documentation notes that NGD API data can support applications such as flood-risk modelling and land-cover classification.
Choosing the Right OS Mapping Data
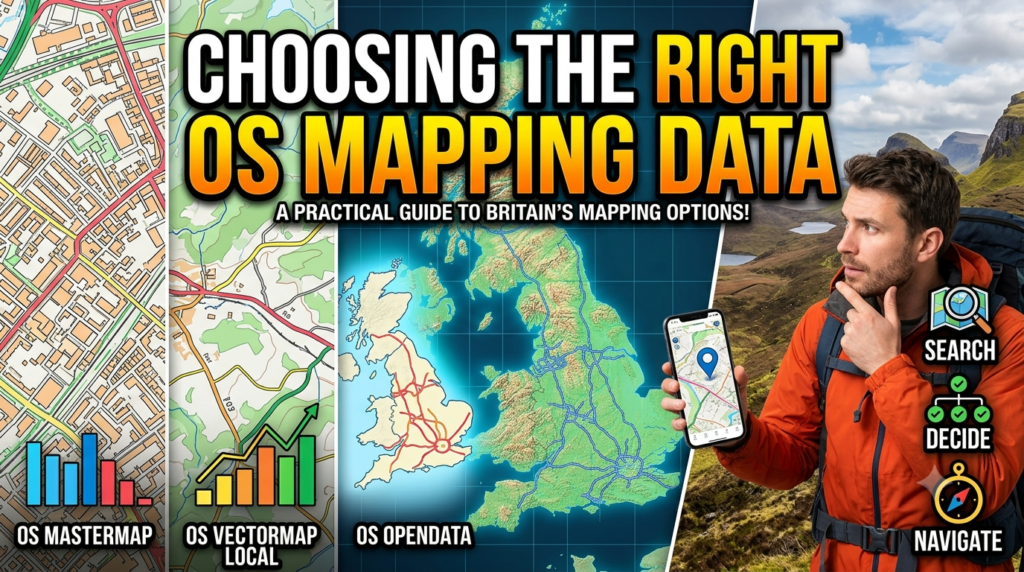
Selecting an OS mapping product should not begin with the most detailed dataset available. Instead, start by defining the task, geographic area, required resolution, update frequency, software environment and licensing requirements. Someone planning a countryside walk has very different needs from an organisation building a national infrastructure database. The right dataset is therefore the one that provides sufficient information for the job without introducing unnecessary complexity.
| Requirement | Suitable mapping approach |
| Detailed local geographic analysis | OS MasterMap Topography Layer |
| Regional visual context | OS VectorMap District or related regional mapping |
| Interactive web maps | OS NGD API – Tiles |
| Custom geographic analysis | OS NGD API – Features |
| Outdoor navigation | OS Explorer or Landranger-style leisure mapping |
| Broad national overview | Small-scale OS mapping products |
| GIS and database workflows | Structured vector datasets and APIs |
The available OS portfolio spans detailed mapping, national-scale products, imagery and leisure mapping. Current OS documentation lists products such as OS MasterMap Topography Layer, OS VectorMap Local, OS Open Zoomstack, OS VectorMap District, raster mapping products and imagery products across different scales and use cases.
Read More:-
How Does Strikingly Simplify the Website Building Process?
Building Your Dream Website with Site123
Boost Your E-commerce Strategy with YITH Plugins
Maximize Your Customer Engagement with LiveAgent’s Features
Why STRIPO is Essential for Digital Product Marketersa
Paper Maps vs Digital Data
Paper maps still have a place, particularly when portability, simplicity and outdoor usability matter. A printed map does not need a battery, mobile connection or software environment. For walkers and explorers, the ability to spread a map across a table and understand the surrounding landscape at a glance can be surprisingly powerful.
Digital mapping, however, becomes much more attractive when data needs to be searched, updated, analysed or integrated with other systems. A digital dataset can be queried and filtered, while an API can provide information directly to an application. The distinction is therefore not really about which option is “better.” It is about whether your task requires a map for human interpretation or geographic data for computational analysis—or, a mix of both, as is frequently the case.




Conclusion
Ordnance Survey maps and mapping data are much more than traditional paper maps. They form part of a broad geographic information ecosystem covering detailed topographic features, imagery, leisure mapping, national databases and modern APIs. Products such as OS MasterMap Topography Layer provide highly detailed representations of Great Britain’s physical environment, while the OS National Geographic Database brings authoritative geographic information into a structure designed for modern analytical workflows.
The most important thing to remember is that there is no single OS dataset that suits every purpose. Scale, geographic coverage, feature content, update requirements, data format, licensing and intended use all influence the right choice. Once those factors are understood, OS mapping data becomes far easier to navigate—whether the goal is planning a walking route, managing infrastructure, developing a GIS application, analysing environmental risks or building an interactive web map. In a world where location influences almost every physical activity, dependable geographic information provides the foundation for better decisions.
FAQs
Q. What is an Ordnance Survey map?
A. An Ordnance Survey map is a map produced using geographic information maintained by Ordnance Survey, Great Britain’s national mapping agency. OS provides both traditional printed maps and digital mapping products covering different scales and purposes.
Q. What is OS MasterMap Topography Layer used for?
A. OS MasterMap Topography Layer is used for detailed geographic analysis and mapping. It represents physical and other geographic features such as buildings, roads, land, water, structures and boundaries across Great Britain.
Q. What is the OS National Geographic Database?
A. The OS National Geographic Database (OS NGD) is a central store of Ordnance Survey’s authoritative geographic data for Great Britain. It is designed particularly for analytical use and can be accessed through OS Data Hub services and APIs.
Q. What is a TOID in Ordnance Survey data?
A. A TOID, or Topographic Identifier, is a unique reference associated with an individual topographic feature in OS MasterMap. It helps users identify and reference geographic objects within the dataset.
Q. Can Ordnance Survey data be used in GIS?
A. Yes. Many OS digital products are specifically designed for GIS and database environments. Depending on the product, data can be supplied in formats such as GeoPackage, GML and vector tiles, while APIs provide additional ways to access geographic information programmatically.